🧮 MICF ’25 in 9 charts
55 shows, 4 weeks, and 1 crepe. A data driven wrap up of my MICF 2025 viewing habits.
Quick Stats
👀 I saw 55 shows (⬇️ from 68 last year)
🏃 I visited 18 venues
🤓 I sat in the front row 15 times
🔁 I saw 4 shows in a day 4 times
⏳ I watched 2.2 days of comedy
🍓 I had 1 crepe (nutella + strawberry)

How much of the festival did I see?
In total I saw 55 shows, or about 8% of the festival. This is down from last year’s count of 68 shows or 10% of the festival.
Which venues did I visit to see shows?
This year there was a big shift in how I attended venues. Last year I was at more venues seeing less shows at each. In contrast, this year was marked by more shows at each venue, but less of them.
I think this probably comes down to the loss of scooters in Melbourne's CBD. Last year I could get between geographically disparate venues in ten minutes or less, but this year meant a reliance on foot travel (slow), PTV (reliant on timing and location), and driving (parking is a nightmare).
How much of each venue's program did I catch?
Only one venue where I saw everything on the program—and that was one show (Vic Pride Centre). Interestingly even the venues that I visited the most (Motley & Malthouse) didn't have me see more than 50% of their program. There's just so much to see.
Where did the acts I saw come from?
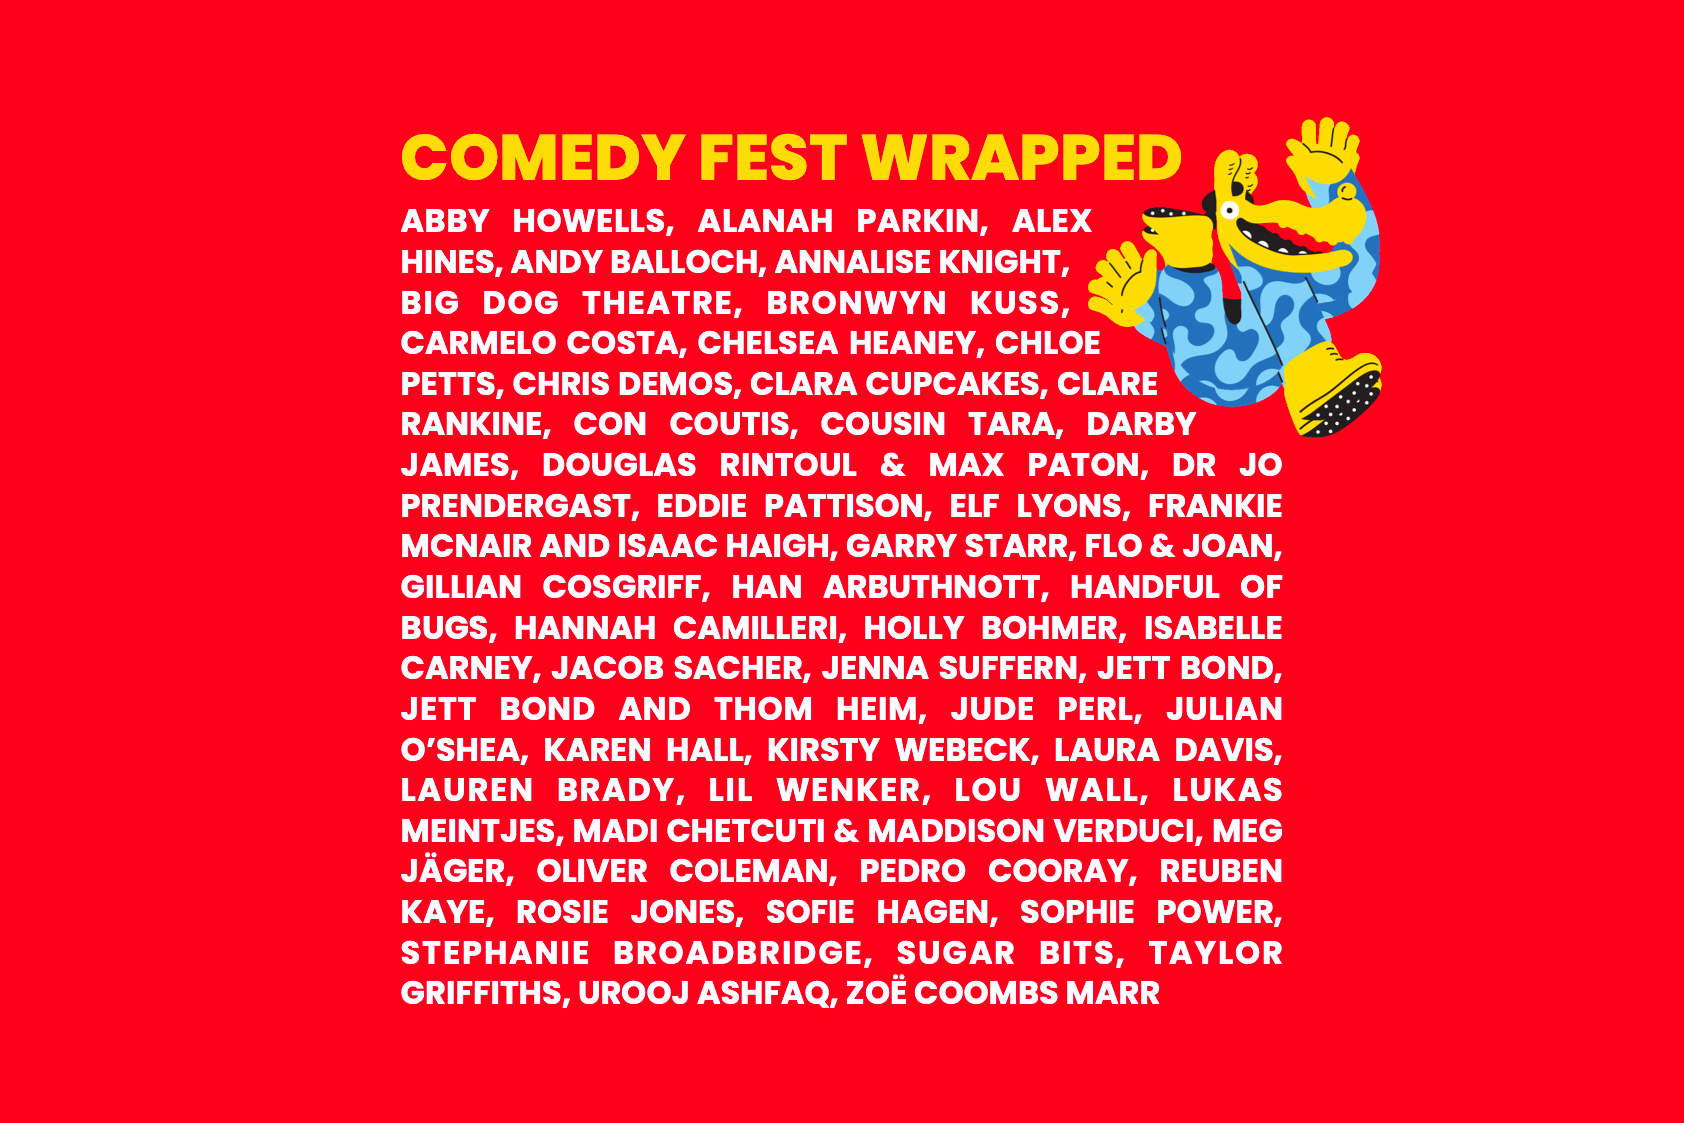
Shoutout to Sofie Hagen from Denmark and Urooj Ashfaq from India who made up the entirety of the acts I saw from outside the Anglosphere.
What was the financial value of the tickets I received?
Shoutout to all the incredible artists who invited me, invited the Green Rooms, or let me get in with my little artist pass—I'm so lucky and so grateful.
When did I watch each show?
Georgie and I didn't plan breaks in our schedule, but inadvertently ended up taking most weekends (bar the final one) off—by the end of the week we were just that tired.
Who lead the creative teams of the shows I saw?
Let's start with the good news. Last year I saw 28 shows led by women, which was contrasted by 34 this year—a massive jump that I'm excited to have made (because let's be honest, male comedians aren't the ones making the most exciting work at the moment).
Last year 41% of the shows I saw were lead by queers, which was massively overshadowed this year's 64%. The count of Trans/GNC folk I saw this year fell in material terms (from 12 to 10) but rose in proportion of the total shows I saw.
And finally, disappointingly, only 5% of the shows I saw had POC in the key creative teams, compared to 23% last year. I think this is attributable both to a lack of focus on this when choosing what shows to see, but also a change in how I counted this data—last year I included lineups featuring POC in my count, whereas this year I wanted to specifically consider when projects were *lead* by these folks.
Regardless, a clear indicator of where to focus my viewing habits next year.
Who did I see shows with?
The size of each node indicates how many shows that person saw (with me), while the width of each link indicates how many shows they saw with the person they're linked to (with me).
This graph is really fun—try clicking and dragging it. 👀
Extra Bits & Bobs
Proud to say I got through the entire festival without getting sick once—masks work to prevent illness of all kinds, and I'm glad I took the precaution to make sure I could make it to all the brilliant work on offer.
There was exactly one show which mentioned the name Ryan and that was Han Arbuthnott's They/Hehe which had a whole bit about the person Han may have been had their parents named them Ryan. Great fun.